Source: https://adamtheautomator.com/grafana-docker/
Prometheus and Grafana are great tools for both metric data collection and visualization. But like any other tool, both have their strengths and weaknesses. To get the most out of your metric data, you’ll have both Prometheus and Grafana Docker Monitoring tools work in tandem.
In this tutorial, you’ll learn how to monitor your Docker instance and collect time-series data for analysis with Grafana Docker monitoring.
Read on and take your workflow to a whole new level!
Prerequisites
This tutorial comprises hands-on demonstrations. To follow along, make sure to have the following:
- An Ubuntu 20.04 machine – This tutorial uses the Ubuntu 20.04 machine as the Docker host.
Related:How to Install Ubuntu 20.04 [Step-by-Step]
- Docker CE (Community Edition) and Docker Compose – This tutorial uses Docker version 20.10.14 and Docker Compose version 1.29.2
Related:How to Install and Use Docker on Ubuntu (In the Real World)
- Configure your firewall rules to allow traffic on ports 80, 443, and 9323 for HTTP and HTTPS connection and your Docker metrics.
- A user with sudo privileges.
- A registered domain name that points to your server’s IP address – This tutorial uses NGINX as a reverse proxy to route traffic to Grafana through the domain name to Grafana running in Docker.
Related:How To Serve NGINX Subdomains or Multiple Domains
Configuring Docker for Grafana
Before viewing all sorts of Docker metrics on Grafana, you must configure Docker first to expose its metrics via an HTTP endpoint. These Docker metrics can be states of containers available on the Docker host and resource utilization of each container.
To expose the Docker metrics, you’ll create a .json file to configure the Docker daemon:
1. Open the daemon.json file in the /etc/docker/ directory using your preferred text editor and add the following code. The code below configures the Docker daemon to expose the Docker metrics at 0.0.0.0 via port 9323 (endpoint: http://0.0.0.0:9323).
{
	"metrics-addr" : "0.0.0.0:9323",
	"experimental" : true
}
Copy
2. Run the following command to restart the docker service for the changes you made on the daemon.json file to take effect. This command doesn’t provide output, but you’ll check the Docker service’s status in the following step.
sudo service docker restart
Copy
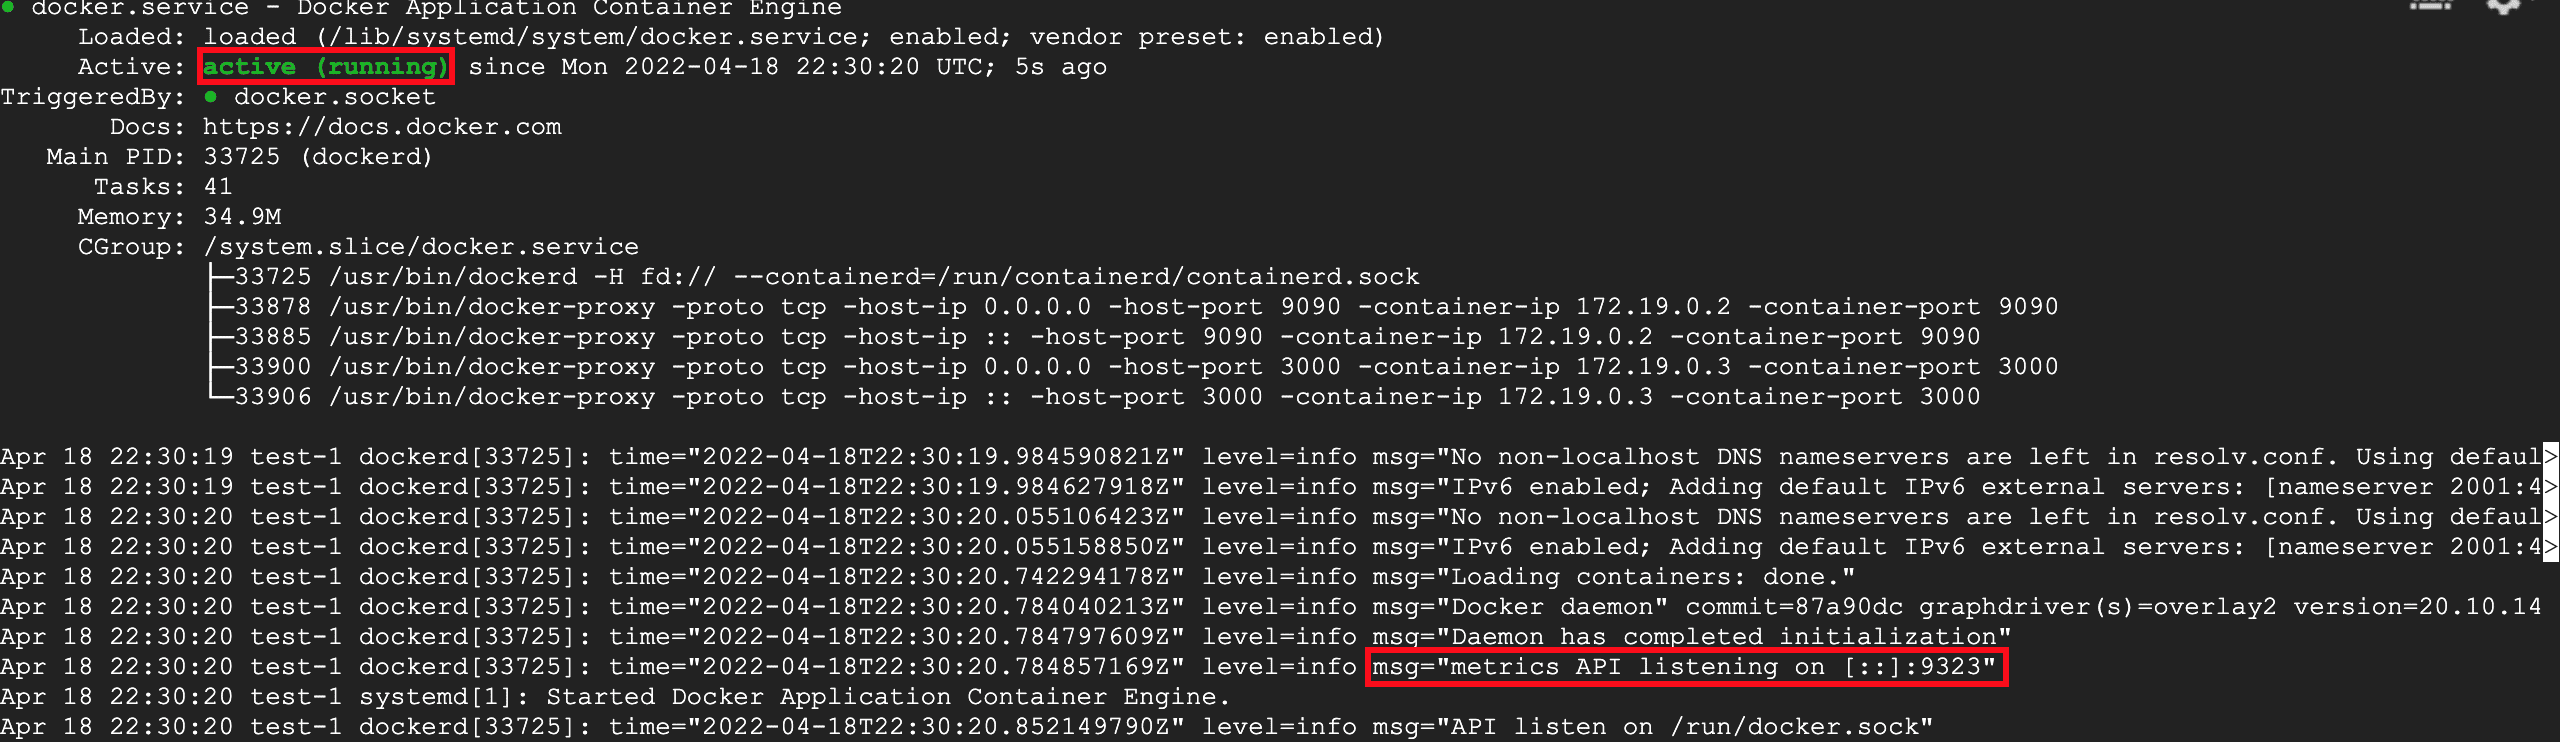
3. Lastly, run the below command to confirm that the Docker service is running properly.
sudo service docker status
Copy
The output below indicates the Docker service is active (running). As you see in the logs, the Docker metrics API is listening on 0.0.0.0:9323.
Accessing the Docker Metrics
Now that you’ve configured Docker for Grafana, feel free to access your raw and unrefined Docker metrics, but only in plain text format. You can access your Docker metrics via the endpoint you set in the daemon.json file.
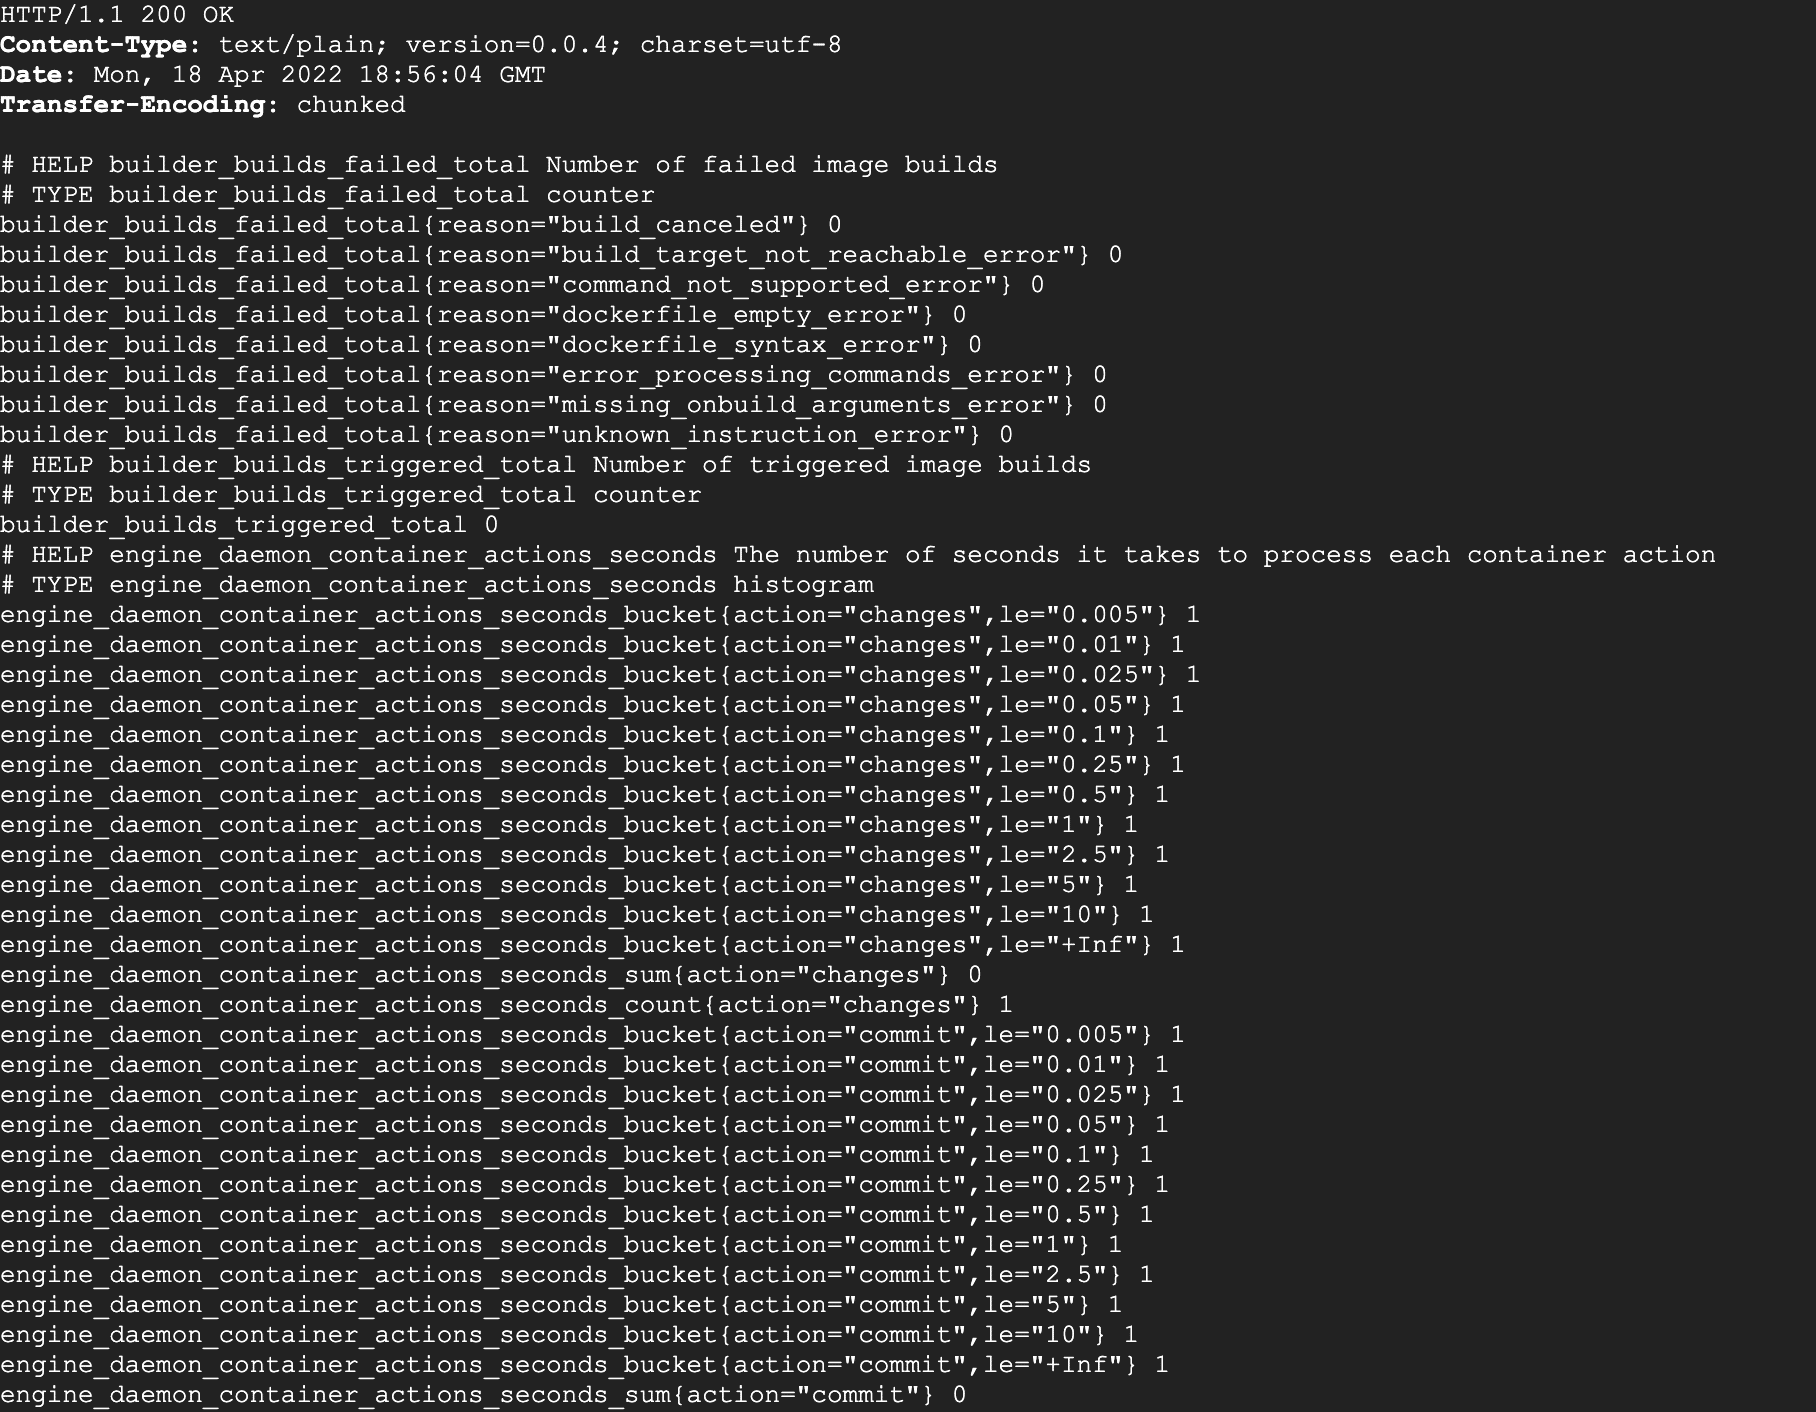
Run the curl command below to view your Docker metrics via the localhost endpoint (http://localhost:9323/metrics).
curl -i <http://localhost:9323/metrics>
Copy
Your raw and unrefined Docker metrics (metric queries and values) should look similar to those below.
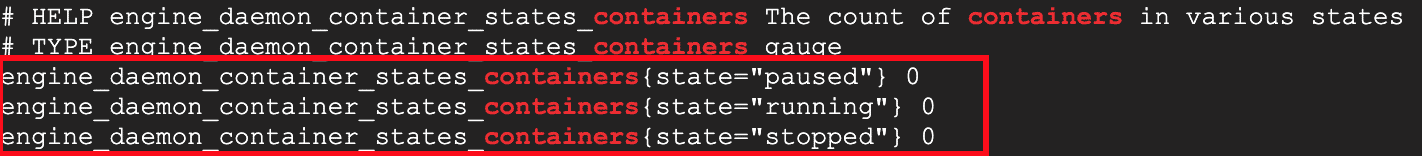
Since this tutorial focuses only on container state metrics, pipe the grep command to extract metrics on the state of available Docker containers.
curl -i <http://localhost:9323/metrics> | grep containers
Copy
The image below displays the queries and values for the different container states (paused, running, and stopped). The values for each query shown below are set to 0 for all the container states, indicating no containers are currently available.
Setting up Prometheus to Run on Docker
The Docker metrics are currently exposed via the endpoint you previously configured. Now it’s time to set up Prometheus to run on Docker via Docker-compose.
You’ll configure a job on Prometheus to scrape the Docker metric data from the exposed endpoint configured as a Prometheus target.
1. Run each command below to create a project directory (~/monitoring) and configuration directories as volumes for each service running via Docker-compose.
# Create a directory for prometheus.yml,
# docker-compose.yml configuration file for the Prometheus,
# Grafana, NGINX, and Certbot container deployments
mkdir -p ~/monitoring/prometheus

# Create a directory for Grafana datasource configurations
mkdir -p ~/monitoring/grafana/provisioning/datasources

# Create a directory for NGINX configurations
mkdir -p ~/monitoring/nginx/conf

# Create www and conf directories for Certbot configurations
mkdir -p ~/monitoring/certbot/www
mkdir -p ~/monitoring/certbot/conf

# Set ~/monitoring directory as the working directory
cd monitoring
Copy
2. Next, create a file called prometheus.yml with your preferred editor in the ~/monitoring/prometheus directory, and populate the code below. Be sure to replace <YOUR_SERVER_IP> with your server’s IP address, and save the changes.
Without this file, Prometheus can’t scrape metrics and store them in a time-series database for analysis.
The following code configures Prometheus and the Docker metric endpoint as a target on Prometheus for scraping at set intervals.
# Set global configuration
global:
  scrape_interval:     15s # By default, scrape targets every 15 seconds.
  evaluation_interval: 15s # By default, scrape targets every 15 seconds.
  # scrape_timeout is set to the global default (10s).

  # Attach these labels to any time series or alerts when communicating with
  # external systems (federation, remote storage, Alertmanager).
  external_labels:
      monitor: 'my-project'

# Load and evaluate rules in this file every 'evaluation_interval' seconds.
rule_files:
  # - "first.rules"
  # - "second.rules"

# A scrape configuration containing exactly one endpoint to scrape:
# Here it's Prometheus itself.
scrape_configs:
  # The job name is added as a label `job=<job_name>` to any timeseries
  # scraped from this config.

  - job_name: 'prometheus'

    # Override the global default and scrape targets from this job every 5 seconds.
    scrape_interval: 5s
    static_configs:
         - targets: ['localhost:9090']

  - job_name: 'docker-metrics'
    scrape_interval: 5s
    static_configs:
		# Replace <YOUR_SERVER_IP> with your server IP
      - targets: ['<YOUR_SERVER_IP>:9323']
Copy
3. Create another file called datasource.yml in the ~/monitoring/grafana/provisioning/datasources directory, add the code below and save the file.
The code below sets Prometheus as a data source on Grafana since Grafana requires a data source to pull data from.
# config file version
apiVersion: 1

# list of datasources to insert/update depending
# on what's available in the database
datasources:
  # <string, required> name of the datasource. Required
- name: Prometheus
  # <string, required> datasource type. Required
  type: prometheus
  # <string, required> access mode. direct or proxy. Required
  access: proxy
  # <string> url
  url: http://prometheus:9090
Copy
4. Lastly, create a file named grafana.config in the ~/monitoring/grafana/provisioning/ directory and add the configurations below.
The following lines set your Grafana admin password and user sign-up to false as you will not need the feature.
GF_SECURITY_ADMIN_PASSWORD=admin
GF_USERS_ALLOW_SIGN_UP=false
Copy
Running Prometheus and Grafana on Docker
You’ve created the necessary configurations and dependencies to run Prometheus and Docker. So it’s time to start up Prometheus and Grafana from the docker-compose.yml configuration file you will create shortly.
Create a configuration file called docker-compose.yml in your project’s root directory (~/monitoring), add the code below, save the file and close the editor.
The following configuration uses version 3.7 of the Docker-compose file format and defines all Prometheus and Grafana configurations.
version: '3.7'

# Persist data from Prometheus and Grafana with Docker volumes
volumes:
	prometheus_data: {}
	grafana_data: {}

# Connect containers via the front-tier and back-tier network
networks:
	backend:

# Container services
services:
	prometheus:
		# Prometheus uses the latest image
    image: prom/prometheus:latest

		# Stores Prometheus data locally in the prometheus directory
    volumes:
      - ./prometheus/:/etc/prometheus/
      - prometheus_data:/prometheus

		# Setup commands for Prometheus
    command:
      - '--config.file=/etc/prometheus/prometheus.yml'
      - '--storage.tsdb.path=/prometheus'
      - '--web.console.libraries=/usr/share/prometheus/console_libraries'
      - '--web.console.templates=/usr/share/prometheus/consoles'

		# Exposes port 9090 to access Prometheus web UI
    ports:
      - 9090:9090

		# Connects Prometheus service to the back-tier network
		networks:
      - backend

		# Restart policy for Prometheus service set to always
    restart: always

	grafana:
		# Grafana uses the latest image
    image: grafana/grafana:latest

		# Sets user ID to 472
    user: "472"
    depends_on:
      - prometheus
    ports:
      - 3000:3000
    volumes:
      - grafana_data:/var/lib/grafana
      - ./grafana/provisioning/:/etc/grafana/provisioning/
    env_file:
      - ./grafana/grafana.config
    networks:
      - backend
    restart: always
Copy
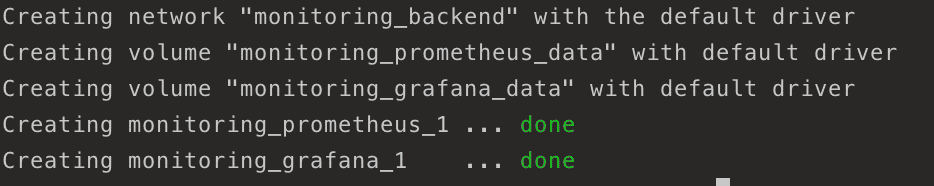
Now, run the docker-compose up command below to create a container in detached (-d) mode.
This command runs Prometheus and Grafana on Docker via Docker-composes as configured in the docker-compose.yml file.
sudo docker-compose up -d
Copy

Securing Grafana with NGINX and Let’s Encrypt
Your Grafana dashboard at this point can be accessed and intercepted by attackers. How to secure the dashboard? You’ll need NGINX to act as a reverse proxy to route traffic to your domain name. At the same time, you’ll set up SSL certificates with Let’s Encrypt to authenticate your server.
Related:Create an NGINX Reverse Proxy in Docker
Create another docker-compose config file called docker-compose-nginx.yml in your project’s root directory (~/monitoring), and add the code below to the file.
The following code serves as NGINX and Certbot docker-compose service configurations, setting NGINX to listen to ports 80 for HTTP connections and 443 for HTTPS.
Related:Activating NGINX to Redirect HTTP to HTTPS Traffic
version: '3'

services:
# NGINX service
  nginx:
		# NGINX uses the latest image
    image: nginx:latest
    ports:
      - 80:80
      - 443:443
		# NGINX service restart policy set to "always"
    restart: always
		# Persist and share NGINX configuration data
    volumes:
      - ./nginx/conf/:/etc/nginx/conf.d/
      - ./certbot/www:/var/www/certbot/
      - ./certbot/conf/:/etc/nginx/ssl/
# Certbot service
  certbot:
    image: certbot/certbot:latest
		# Persist and share Certbot configuration data
    volumes:
      - ./certbot/www/:/var/www/certbot/
      - ./certbot/conf/:/etc/letsencrypt/
Copy
2. Next, create a file named nginx.conf in the ~/monitoring/nginx/conf directory and add the configuration below to the nginx.conf file.
The code snippet below configures NGINX as a reverse proxy to route incoming traffic port through the default port 80 to the Grafana port 3000. Be sure to replace all occurrences of grafana.example.com with your Grafana endpoint URL.
Be sure to replace all occurrences of
grafana.example.comon each code and command through this tutorial with your Grafana endpoint URL.
server {
				# Listen for incoming connections on port 80
        listen 80 default_server;
				# Set your Grafana endpoint URL
        server_name grafana.example.com;
        # Location to store certbot configurations
        location ~ /.well-known/acme-challenge/ {
           root /var/www/certbot;
        }

        location / {
						# Assign incoming requests from port 80 to this URL
            proxy_pass http://grafana.example.com:3000/;
        }
}
Copy
3. Run the docker-compose command below to reload the NGINX container to apply the NGINX configurations (docker-compose-nginx.yml).
sudo docker-compose -f docker-compose-nginx.yml exec nginx nginx -s reload
Copy
As soon as you run the command, you’ll get the following output.

4. Now, run the below command to run the Certbot container and create the certificates in the /etc/letsencrypt/ directory. Be sure to change grafana.example.com with your domain name.
You can access the certificates stored in the /etc/letsencrypt/ directory locally in /certbot/conf.
# Change grafana.example.com to your Grafana URL
sudo docker-compose -f docker-compose-nginx.yml run \
 --rm certbot certonly --webroot \
 -w /var/www/certbot -d grafana.example.com
Copy
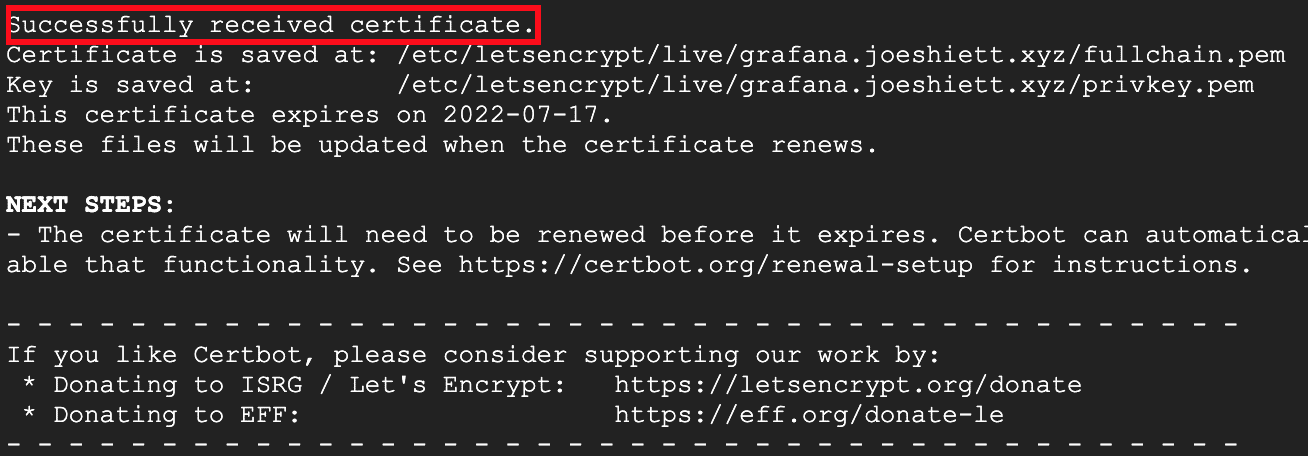
Once the certificates are created, you’ll get the following output.
5. Open the nginx.conf file and add the following code to allow access to Grafana via HTTPS:
server {
				# Listen for incoming connections on port 80
        listen 80 default_server;
				# Change grafana.example.com to your Grafana endpoint URL
        server_name grafana.example.com;
				# Return all HTTP requests to URL to HTTPS
        return 301 https://grafana.example.com$request_uri;
}

server {
				# Listen form incoming connections on port 443 via HTTPS
        listen 443 ssl http2;
				# SSL certificate and private key
				ssl_certificate     /etc/nginx/ssl/live/grafana.example.com/fullchain.pem;
        ssl_certificate_key /etc/nginx/ssl/live/grafana.example.com/privkey.pem;
				# Change grafana.example.com to your Grafana endpoint URL
        server_name grafana.example.com;

        location ~ /.well-known/acme-challenge/ {
					 # Location to store certbot configurations
           root /var/www/certbot;
        }

        location / {
						# Assign incoming requests from port 80 to this URL
            proxy_pass http://grafana.example.com:3000/;
        }
}
Copy
6. Next, run the following command to apply the modified NGINX configurations.
sudo docker-compose -f docker-compose-nginx.yml exec nginx nginx -s reload
Copy
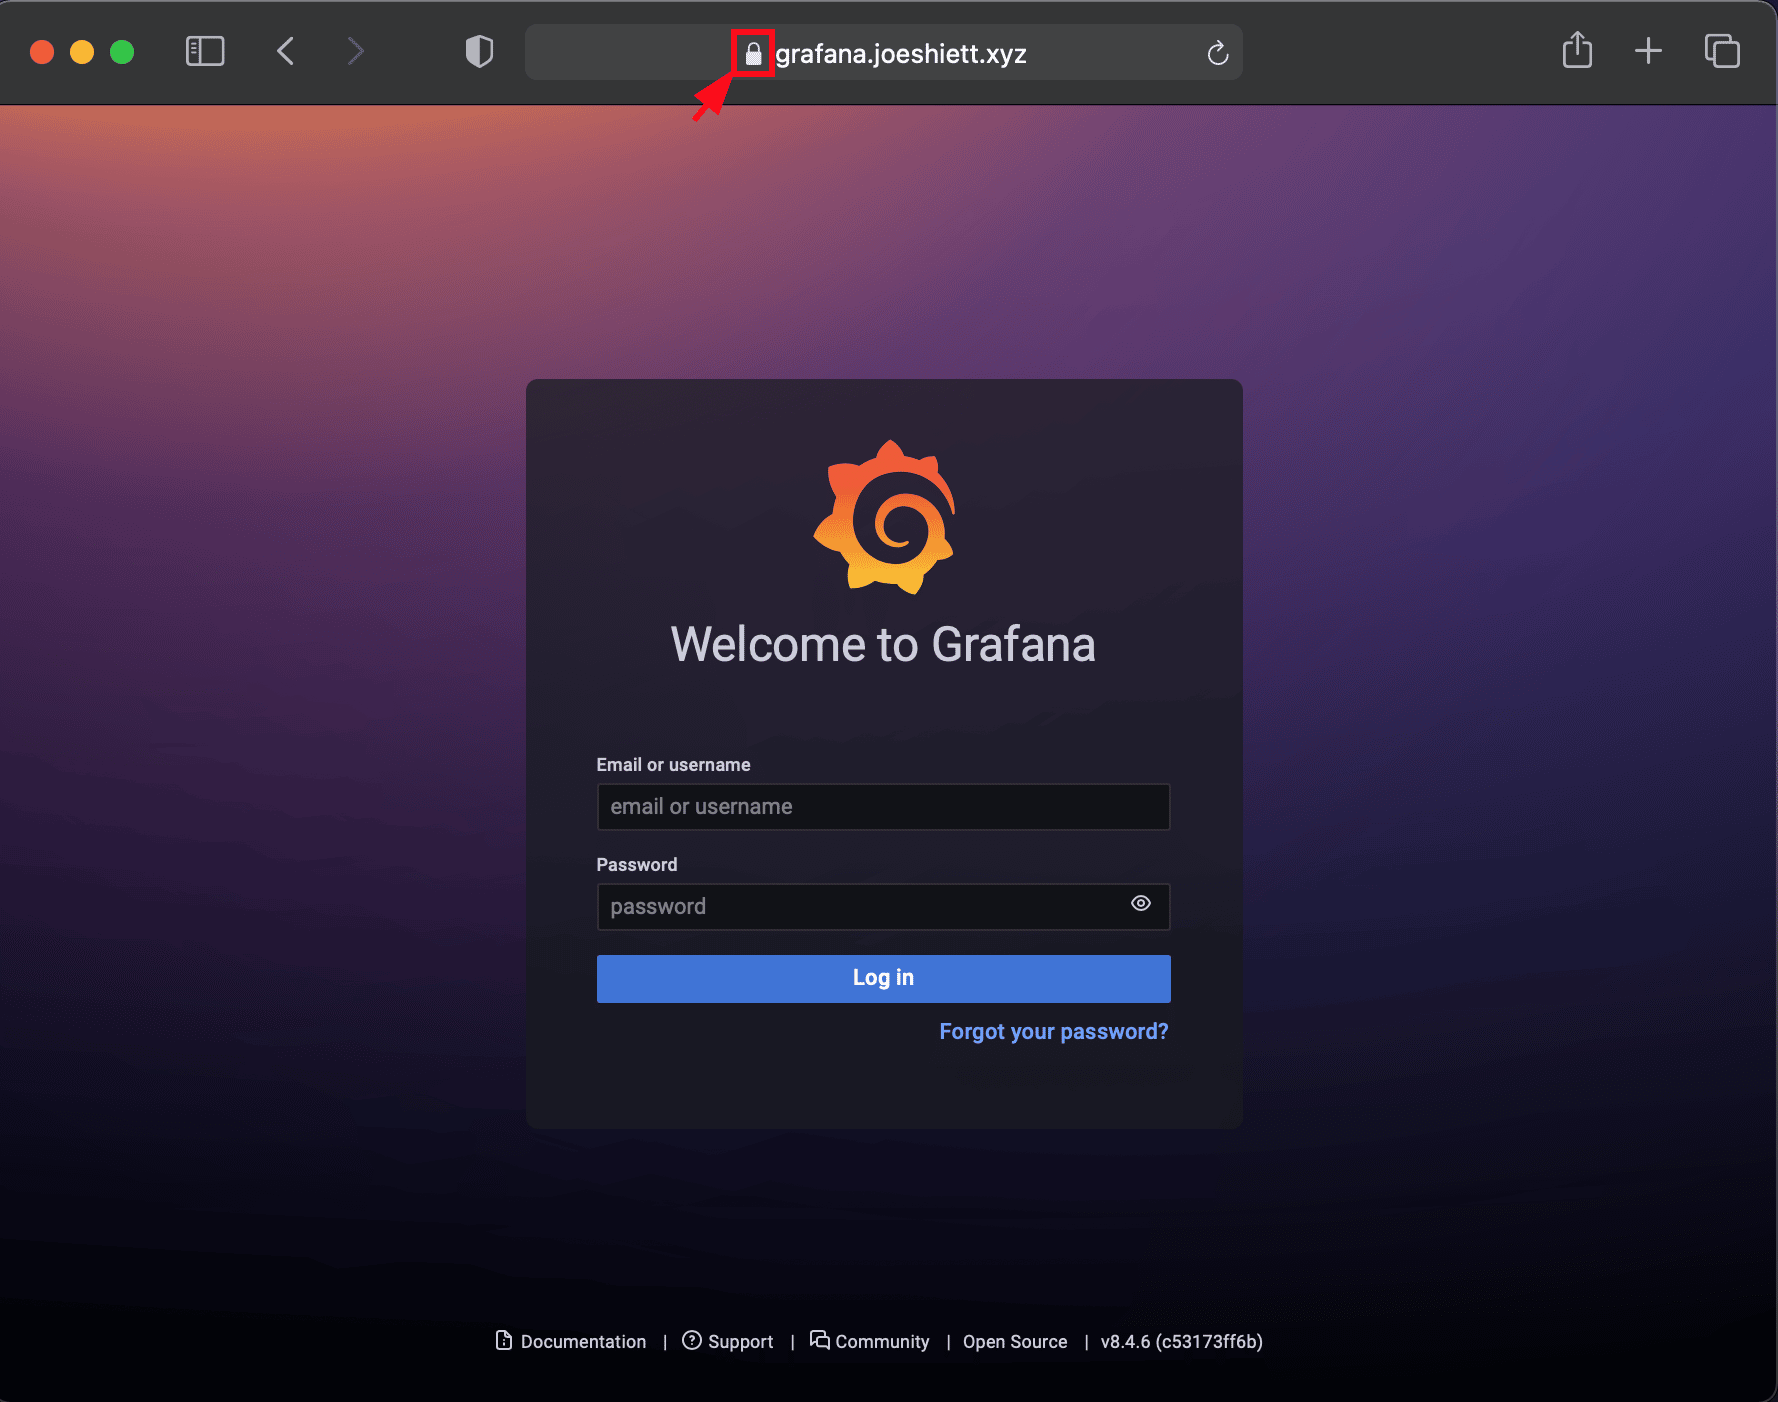
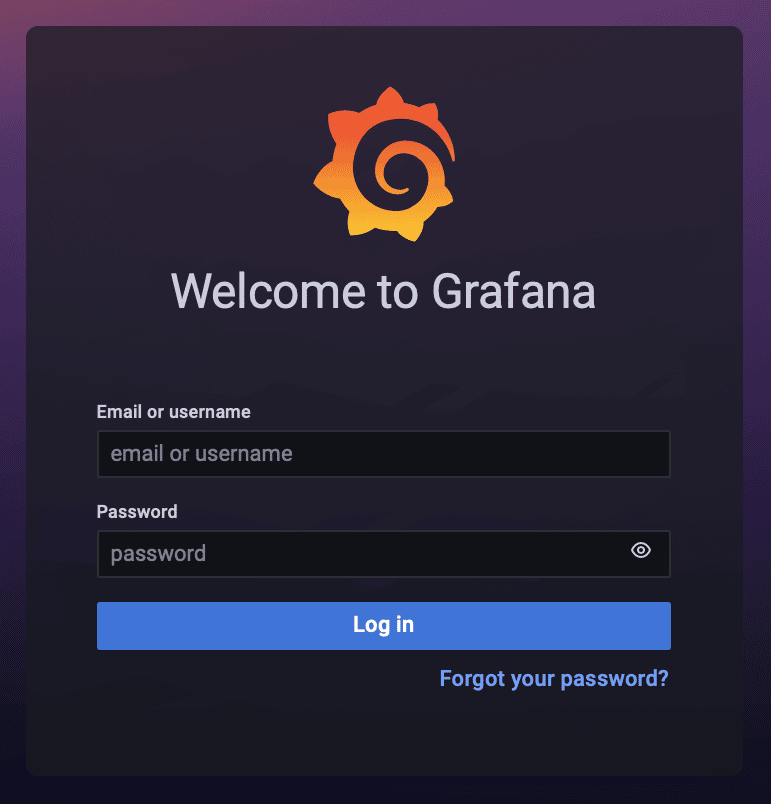
7. Finally, open your favorite web browser and navigate to your domain name. This article uses the domain name grafana.joeshiett.xyz. You’ll get secure access to Grafana (login page) if all goes well, as shown below.
Creating Visualization in Grafana
With everything set up and running, you’re ready to create your first visualization in Grafana to view your Docker metrics. But you’ll first have to log in to Grafana to access your Grafana dashboard.
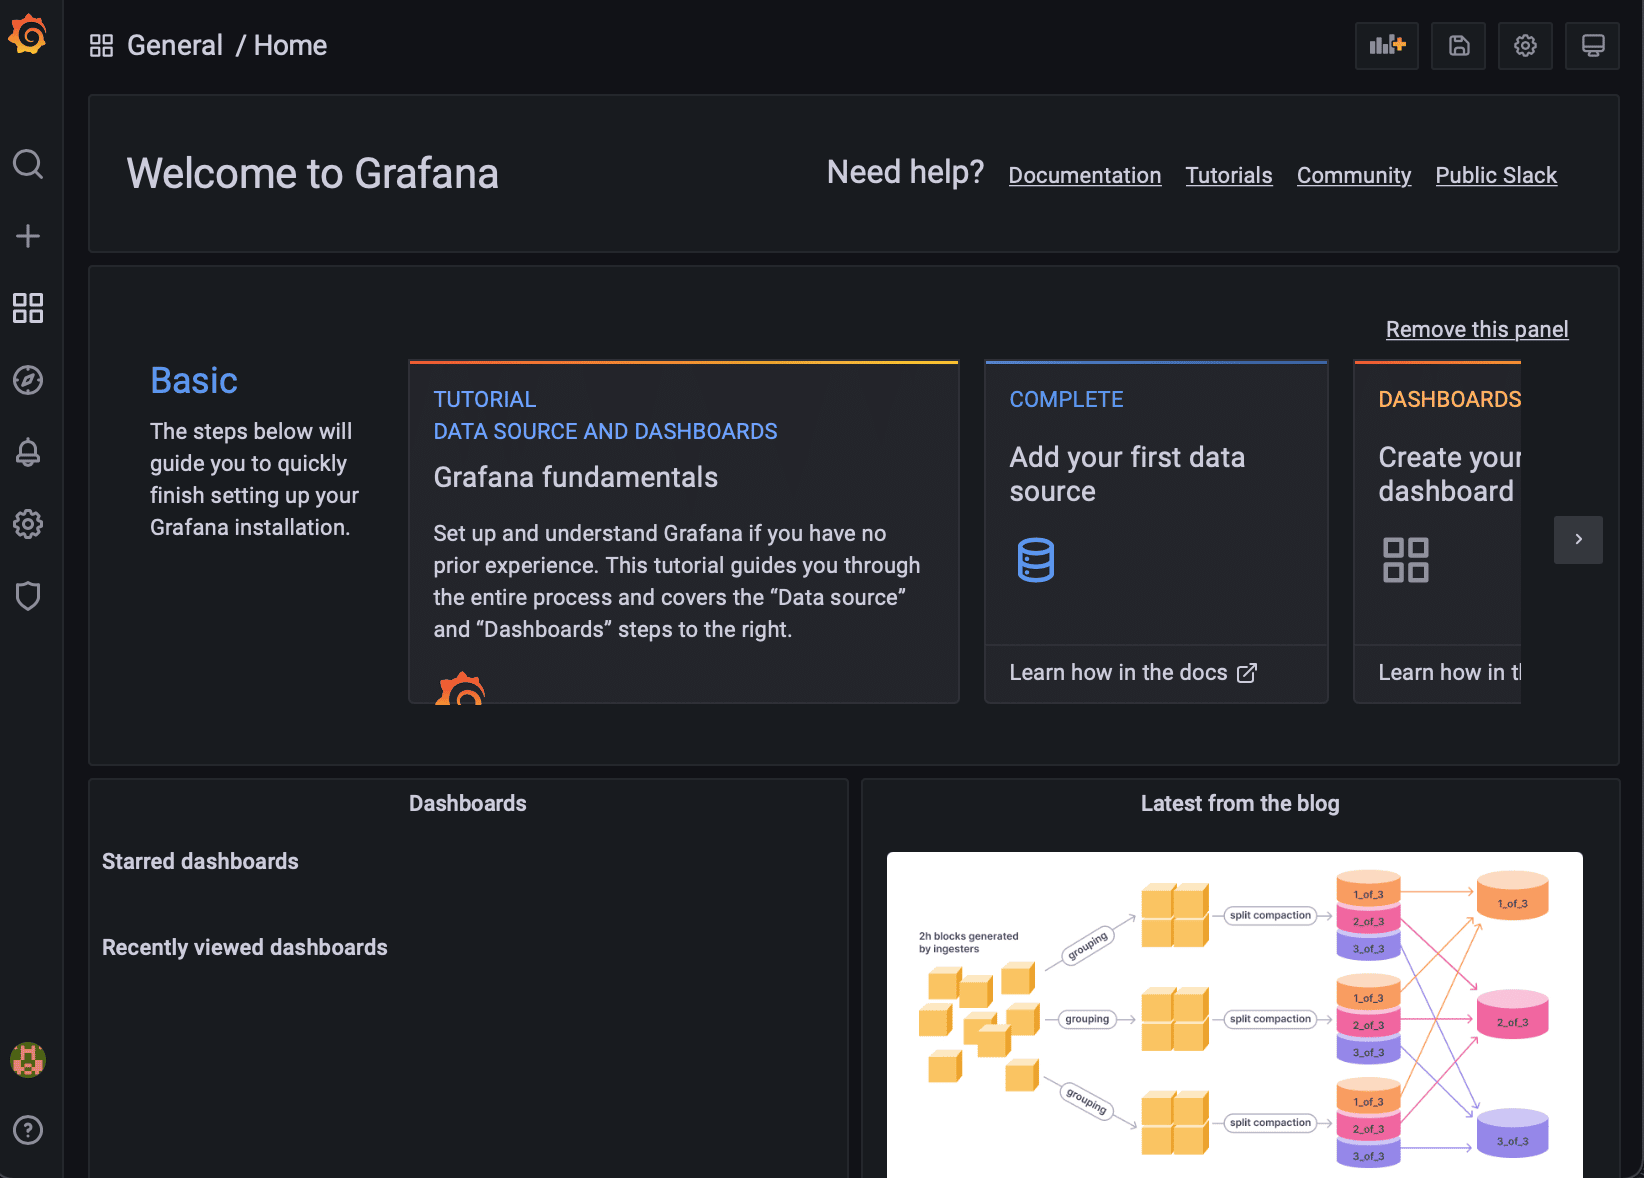
1. Log in to your Grafana with admin as the Username and Password.
Once logged in, you’ll be on the Grafana home page shown below.
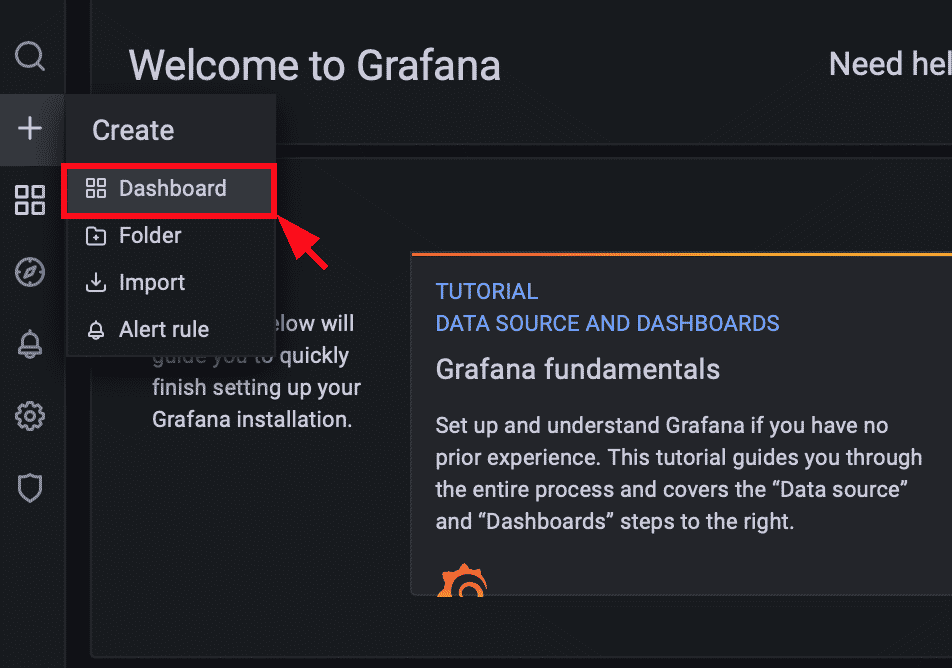
2. Click on the + icon (left toolbar) and choose Dashboard to access your Grafana dashboard to see options for creating a new dashboard.
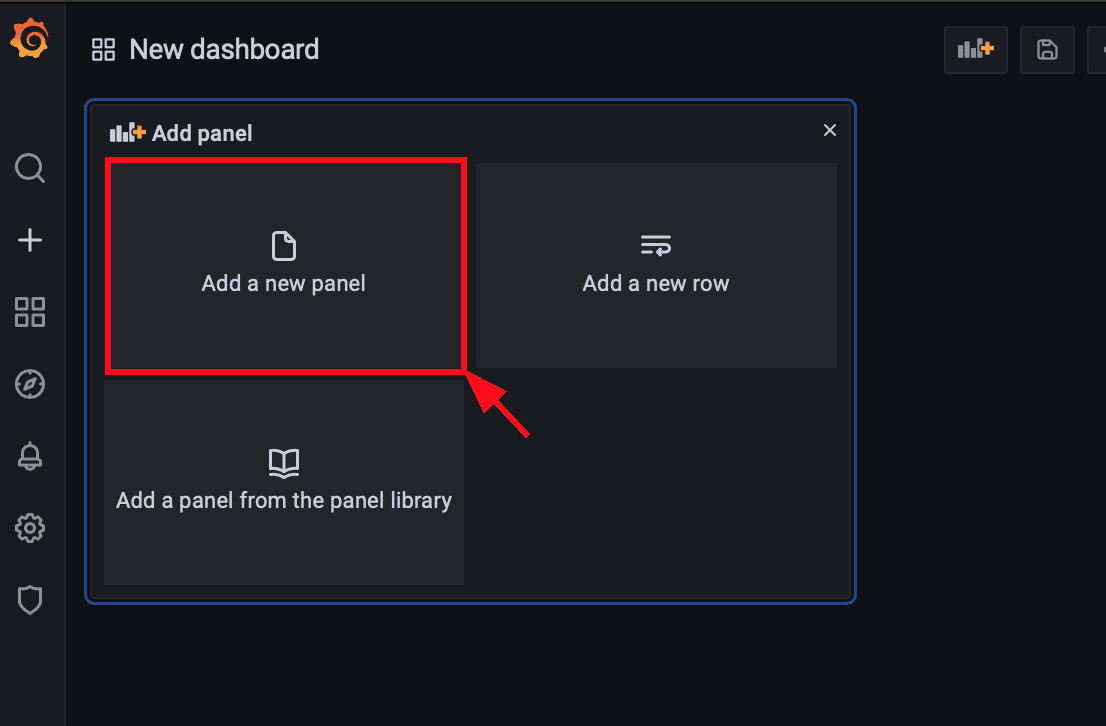
3. On the dashboard, click Add a new panel to create a panel where you can visualize your Docker metrics.
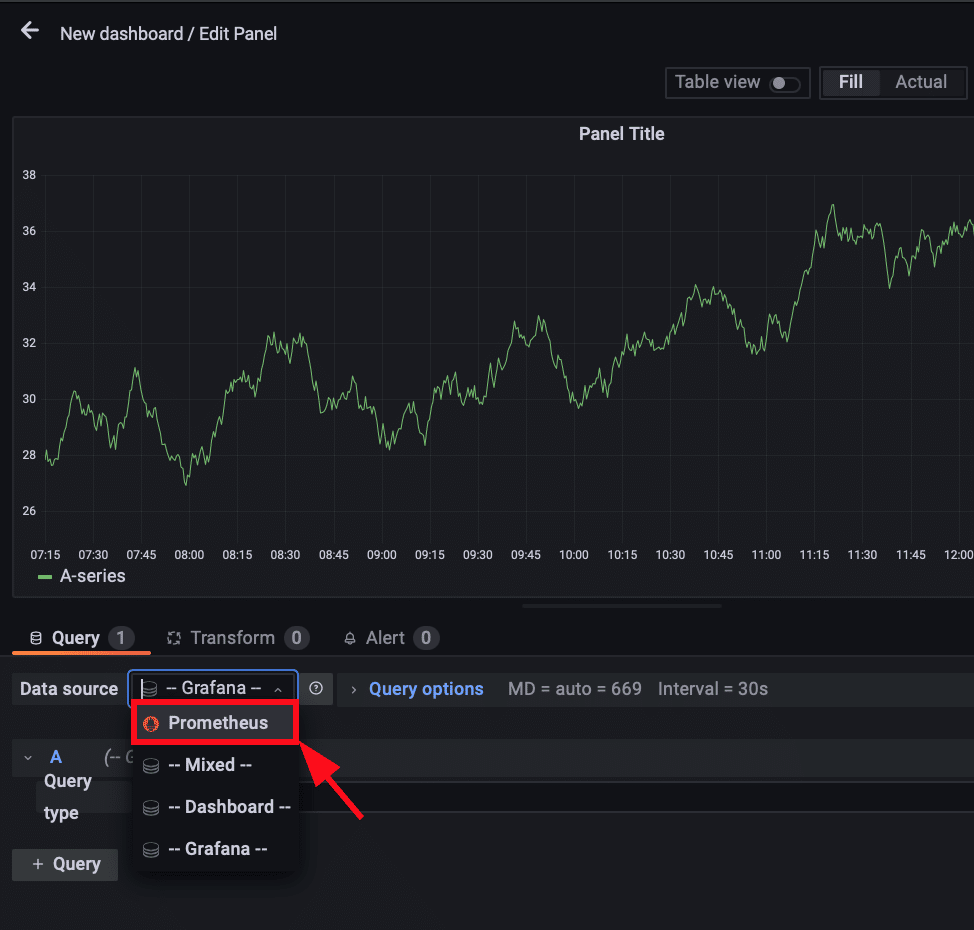
4. Now, click on the drop-down menu and select Prometheus, as shown below, to add Prometheus to the panel as a Data source.
5. Add the following Docker metric query to the Metric browser field to get the different states of available Docker containers.
```bash
engine_daemon_container_states_containers{}
```
Copy
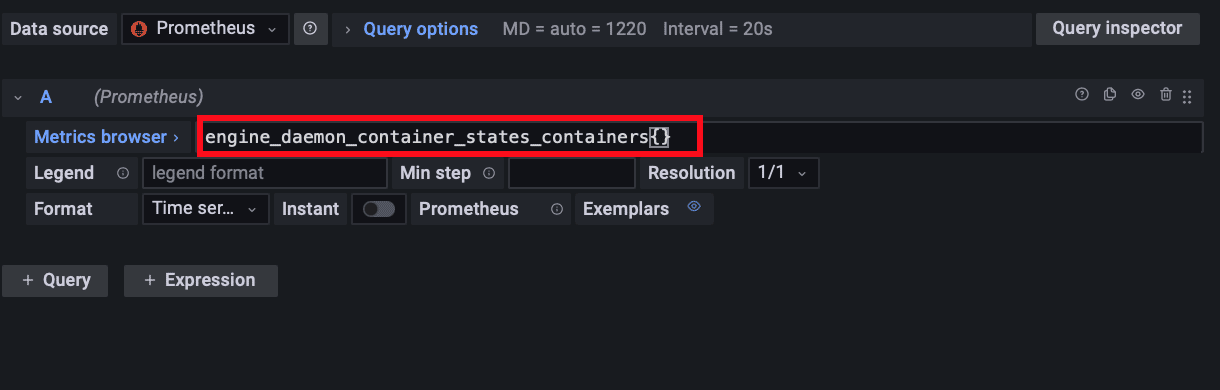
To query for specific Docker state on Grafana, run the following queries: engine_daemon_container_states_containers{state=”running”} engine_daemon_container_states_containers{state=”paused”} engine_daemon_container_states_containers{state=”stopped”}
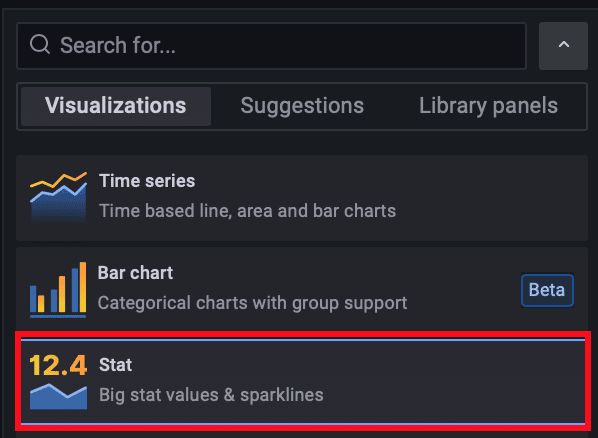
6. Next, click the drop-down menu (top-right of the page) to see other types of visualization you can choose.
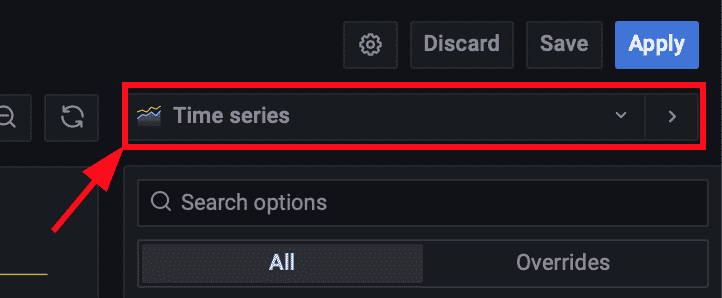
7. Choose your preferred visualization from the list, but this tutorial uses the Stat visualization.
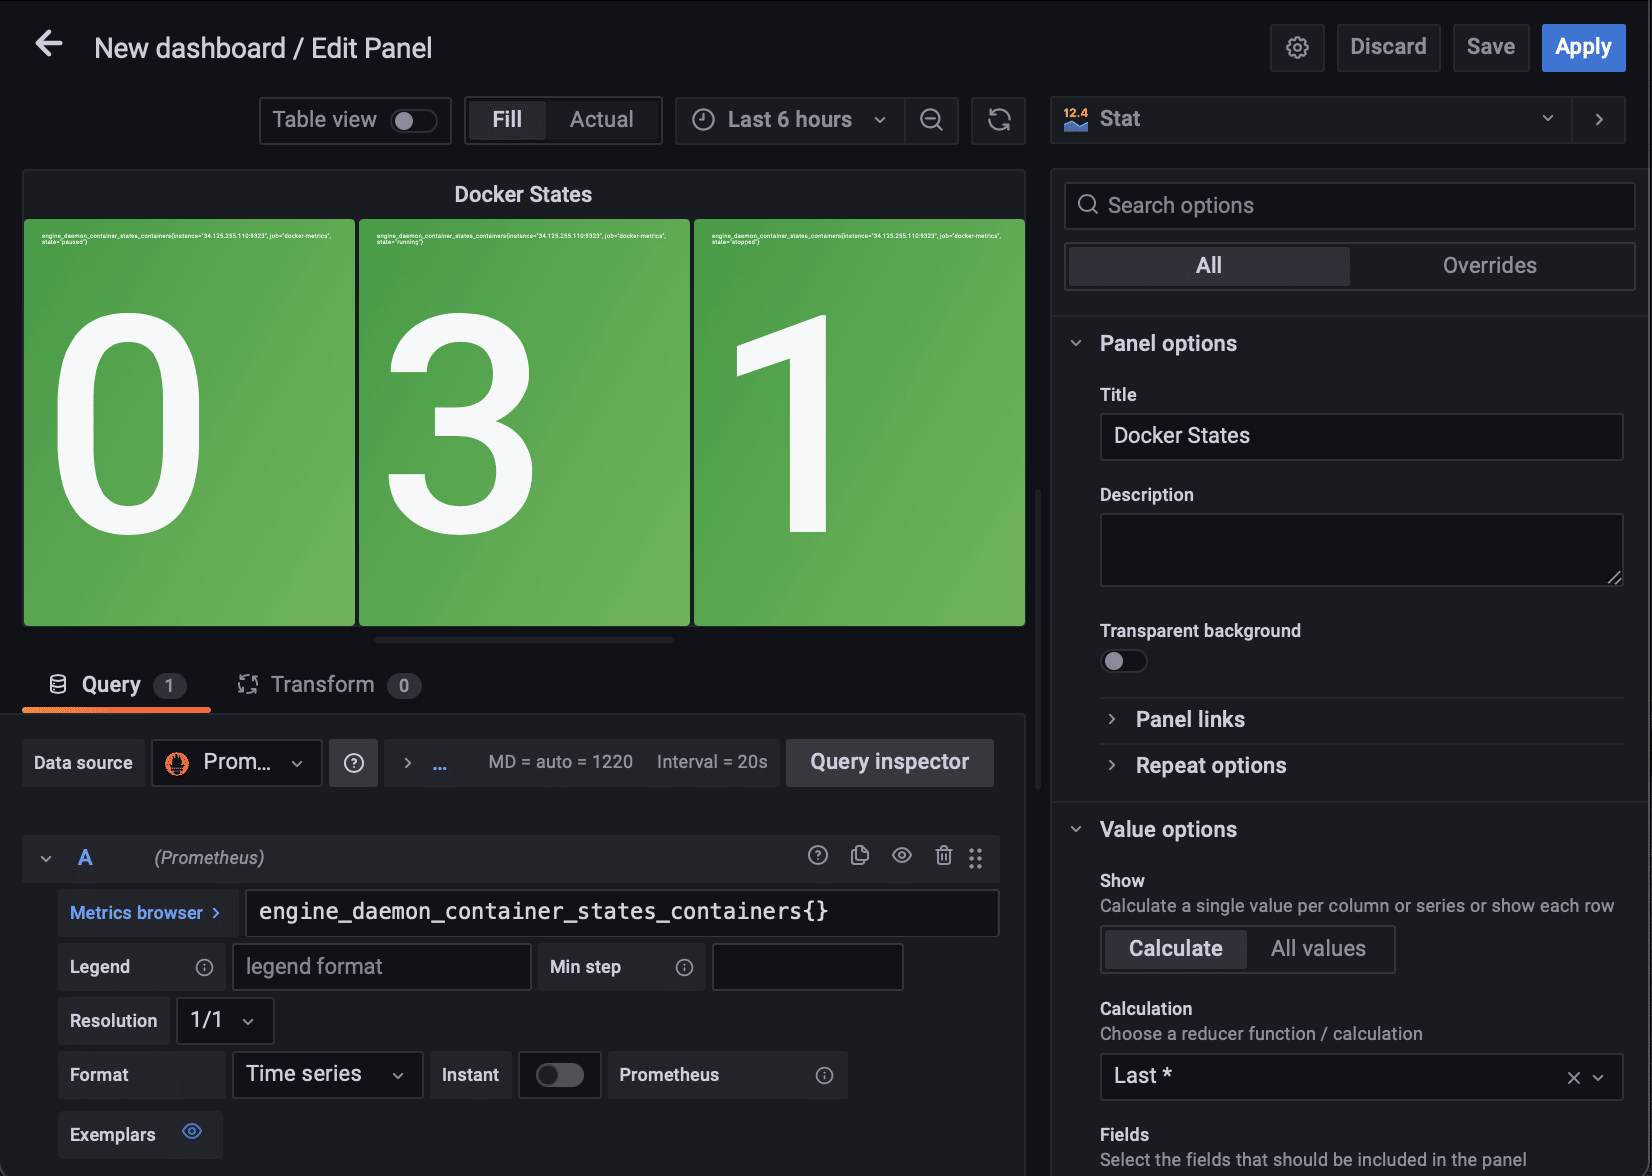
If you choose the Stat visualization, your new dashboard should look similar to the one below.
For this tutorial, the number 3 represents three running containers, 1 represents one stopped container, and 0 represents no paused container.
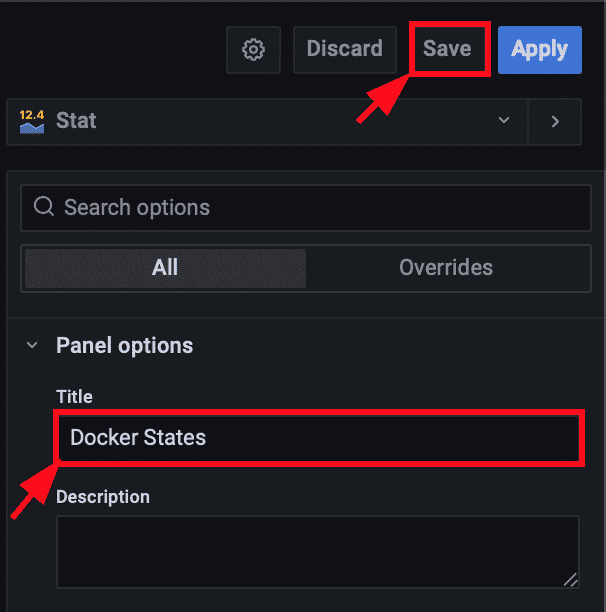
8. Change the panel Title as you like under Panel options (right panel) and click on Save (top-right). The panel title is set to Docker States in this tutorial.
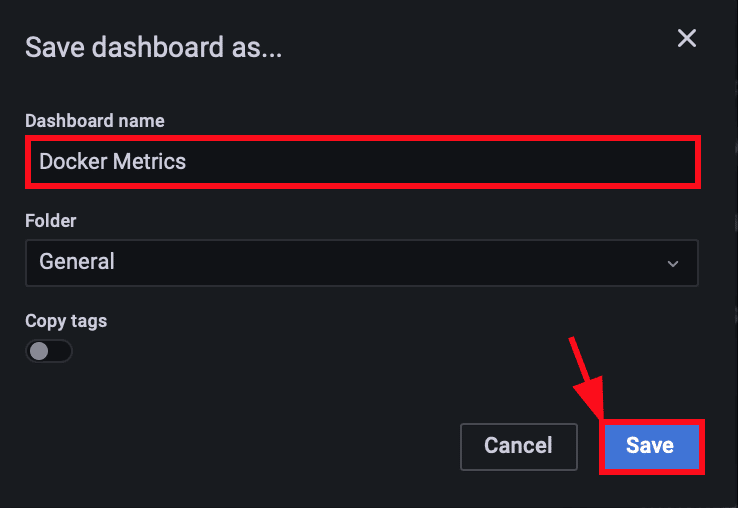
After saving the title, a pop-up window appears where you’ll set a name for your dashboard (step nine).
9. Finally, name the dashboard as you like, but the dashboard is called Docker Metrics in this tutorial. Once you’re happy with the dashboard name, click on the Save button to save the dashboard.
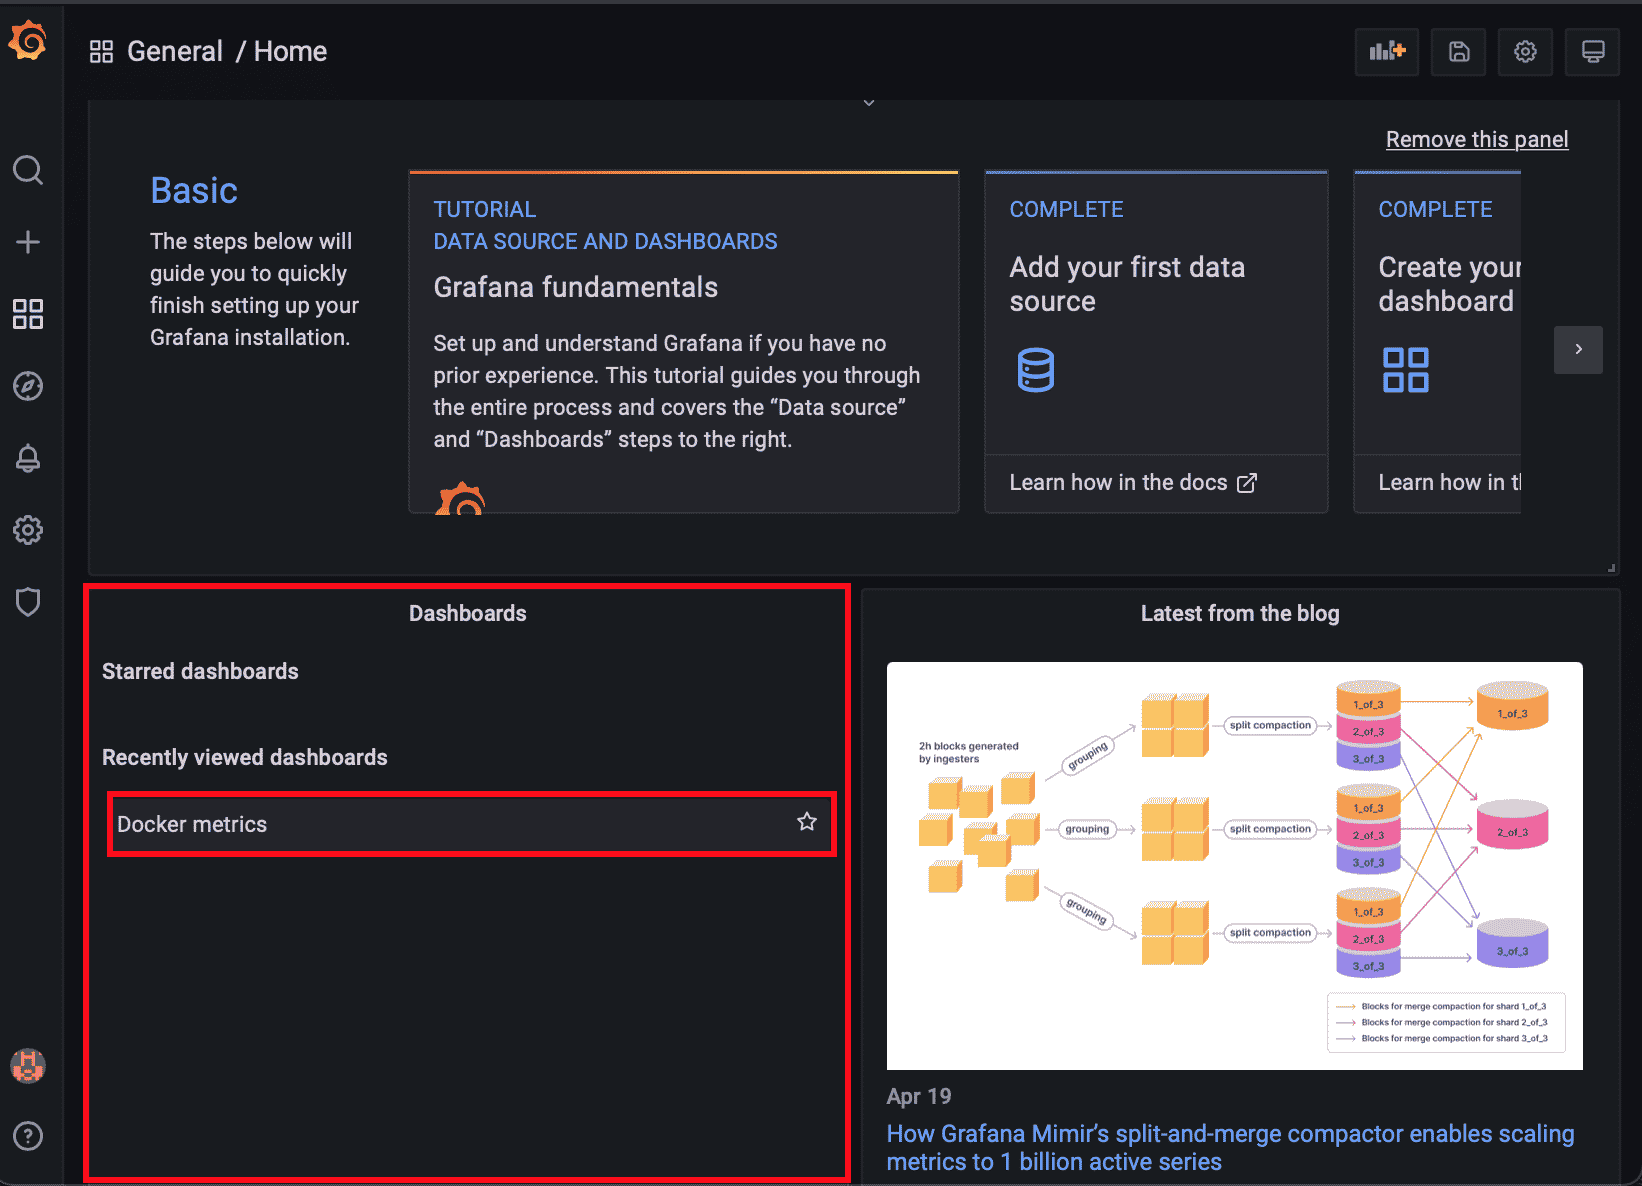
Your dashboard (Docker Metrics) should now be available on your Grafana Home page, as shown below.
At this point, you now have a fully functional dashboard you can use to monitor your Docker metrics.
Conclusion
In this tutorial, you learned how to export Docker metrics to Prometheus via the configured endpoint and made queries on Prometheus to display their values. You’ve also configured Prometheus as a data source on Grafana and finally created a sample dashboard to better view the values obtained from the metric query.
To build on this newfound knowledge, why not set up alerts with Alertmanager, and set up both Prometheus and Grafana on a separate dedicated Ubuntu server? You can also configure more dashboards to your heart’s content so you can view more metrics on your Grafana Home page.