Source: https://www.connectix.nl/using-grafana-to-plot-gps-tracks-from-the-things-network-on-a-live-map/
Some time ago I bought a Dragino lgt-92 GPS Tracker and connected it to The Things Network. The Things Network uses a console to output the payload wich is received from the end-nodes. It’s functional but not user friendly. I was looking for a way to plot the wearabouts of the gps tracker on a live map. You can read here how I managed to make this.

The Things Network uses the community to deliver a free LoRaWAN network. You can connect your own gateway to let people connect with the network and ofcourse you can use your own nodes. However it is not nessecary to have your own gateway. The Things network has a growing number of gateways so the coverage is growing fast.
Adding the Dragino GPS Tracker to TTN
Adding the Dragino GPS Tracker to the things network was easy.
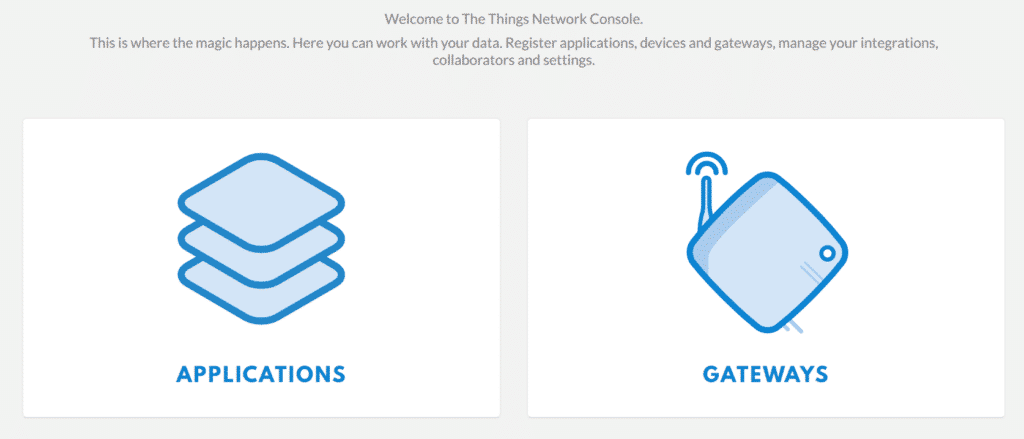
First you have to make an account with TTN. After you logged in you can add a application. Go to this url and click on APPLICATIONS
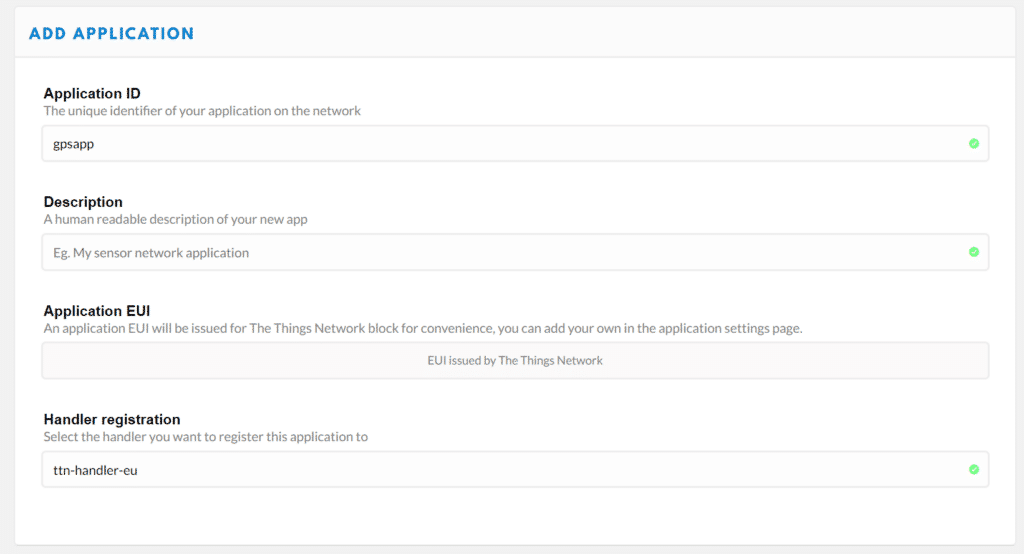
Click on Add Application and give it a id. I used “gpsapp”. You can select the nearest handler.
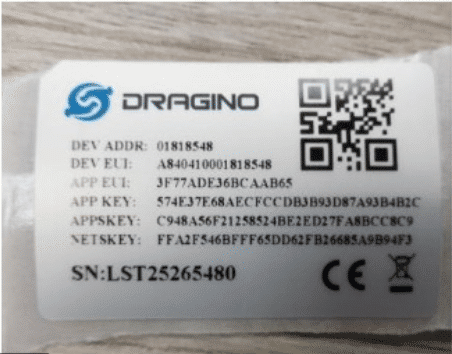
Now you have to enter some information from the label wich was inside the box of the Dragino Tracker.
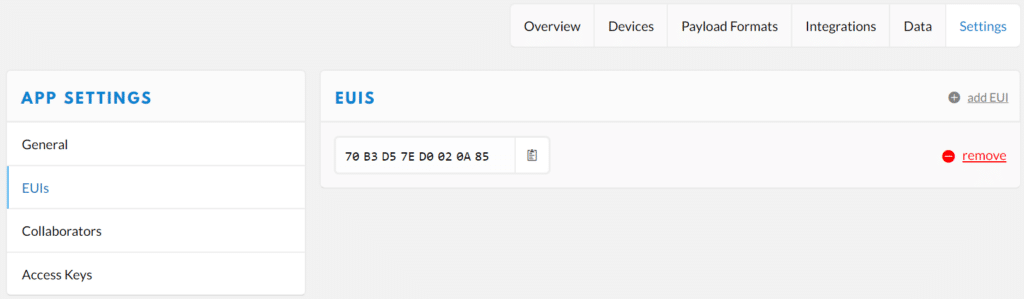
There is an auto-generated Application EUI. You first have to remove this and enter the one from the label.
Go to the devices menu and enter a descriptive Device ID. Fill in the Device EUI from the label and one of the tree App Keys. Klick on Register to finish the registration.
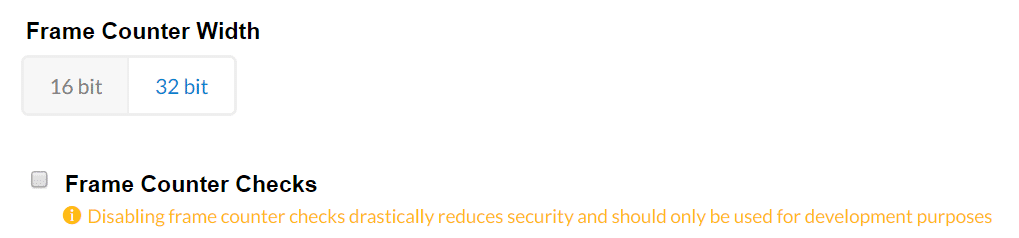
The last thing you have to do is to disable the Frame Counter Checks. This is a security mechanism that does not work well with this kind of devices. Go to the device settings and disable it.
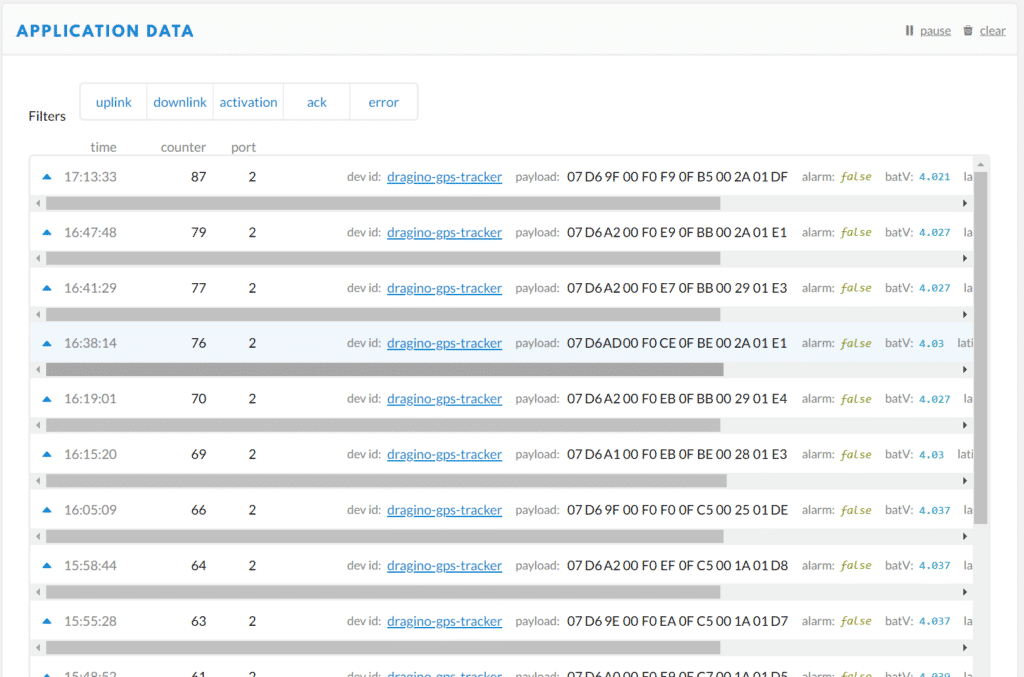
Now turn on the Dragino DPS Tracker and wait for it to connect to TTN. This can take a while to join and activate. You can follow this process in the Application data tab.
I was getting some information in the console. The information wich is displayed is the raw payload wich the tracker transmits. You can use a conversion to make it readable to us humans. To do this you have to make a custom payload format and put it in the console. Go to your application and click on Payload Formats. Enter the following code under Custom and click Save Changes.
function Decoder(bytes, port) {
 // Decode an uplink message from a buffer
 // (array) of bytes to an object of fields.
 var alarm=(bytes[6] & 0x40)?true:false;//Alarm status
 value=((bytes[6] & 0x3f) <<8) | bytes[7];
 var batV=value/1000;//Battery,units:Volts
 value=bytes[8]<<8 | bytes[9];
 if(bytes[8] & 0x80)
 {
 value |=0xFFFF0000;
 }
 var roll=value/100;//roll,units: °
 value=bytes[10]<<8 | bytes[11];
 if(bytes[10] & 0x80)
 {
 value |=0xFFFF0000;
 }
 var pitch=value/100; //pitch,units: °
 var json={
 roll:roll,
 pitch:pitch,
 batV:batV,
 alarm:alarm
 };
 var value=bytes[0]<<16 | bytes[1]<<8 | bytes[2];
 if(bytes[0] & 0x80)
 {
 value |=0xFFFFFF000000;
 }
 var value2=bytes[3]<<16 | bytes[4]<<8 | bytes[5];
 if(bytes[3] & 0x80)
 {
 value2 |=0xFFFFFF000000;
 }
 if (value == 0x0FFFFF && value2 == 0x0FFFFF)
 {
 //gps disabled (low battery)
 } else if (value === 0 && value2 === 0) {
 //gps no position yet
 } else {
 json.latitude=value/10000;//gps latitude,units: °
 json.longitude=value2/10000;//gps longitude,units: °
 }
 return json;
}
When this is done you can check the payload again. The Battery Status, GPS Coordinates Pitch and Roll and Alarm data is visible now
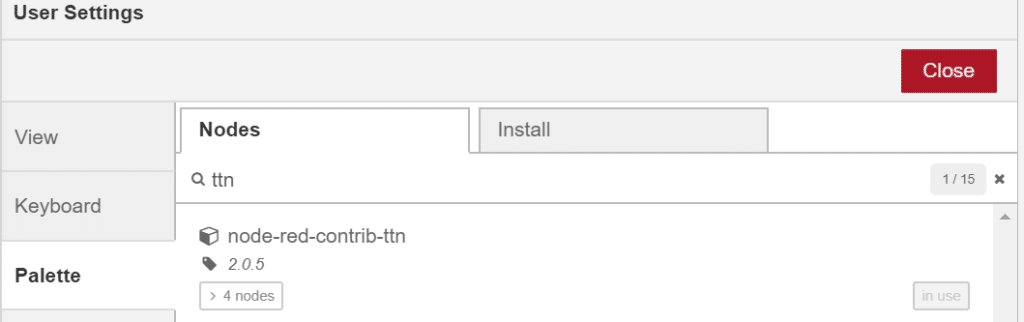
Install Node-RED on your system and install the “node-red-contrib-ttn” pallette via the hamburger menu on the right.
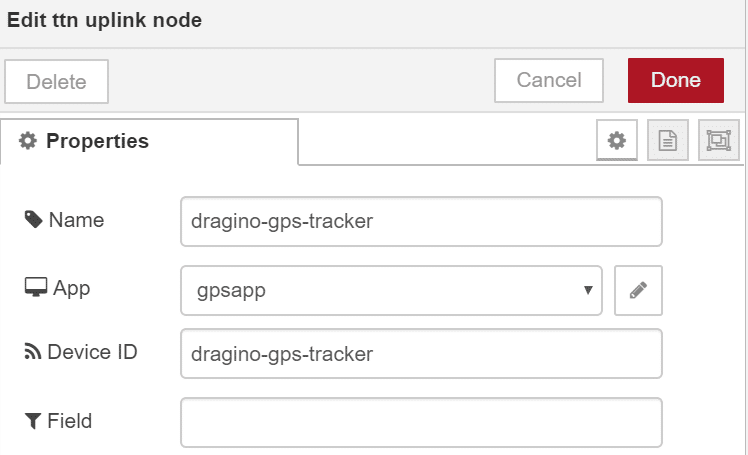
Restart Node-RED and log in again. You will now see some ttn boxes on the left. Drag the ttn-event box to the flow and double click it.
Enter the Device ID wich you entered in the TTN console. You can give it the same name.
Now click on the pencil next to the App. Enter the App ID from the TTN Console and copy the Access Key. The discovery address is filled in automatically.
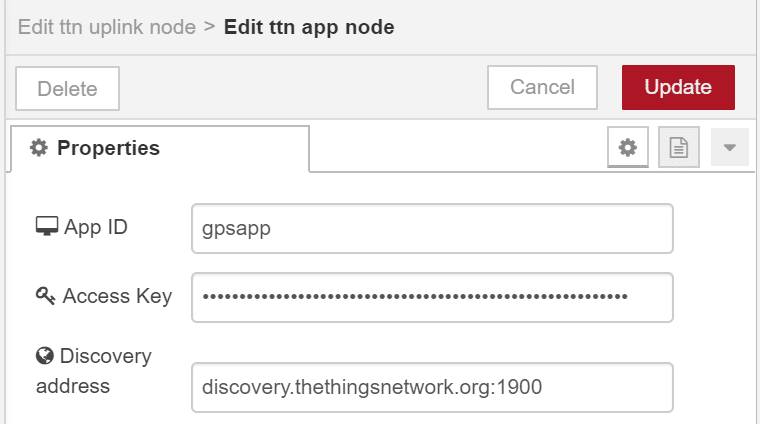
Click on Update to go back to the properties of the uplink node. Click on Done.
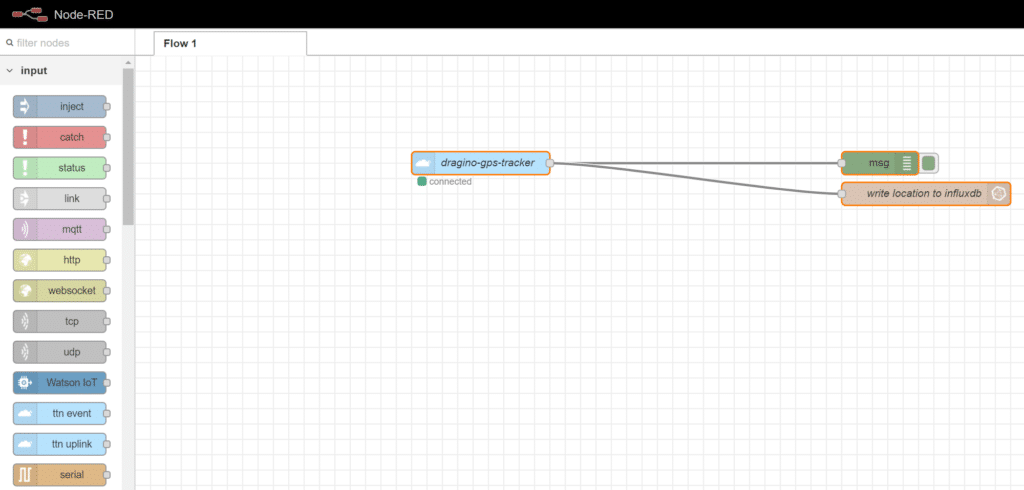
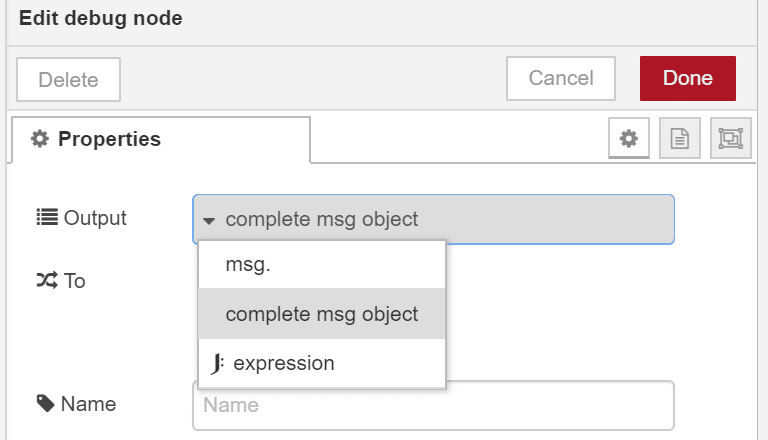
Now drag the green debug box from the output menu on the left to the flow. Connect the gray dots from the blue box to the debug box. Double click on the debug box and select “complete msg object”. To get the full payload. Now click Done.
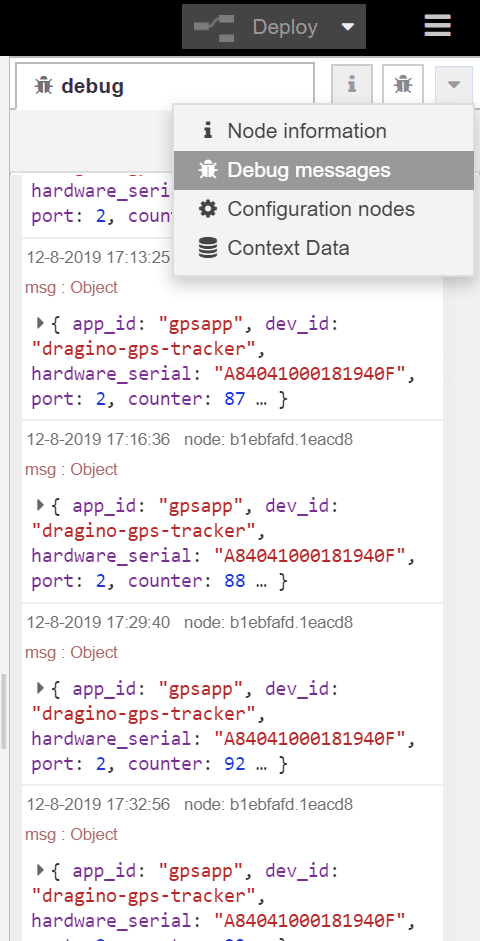
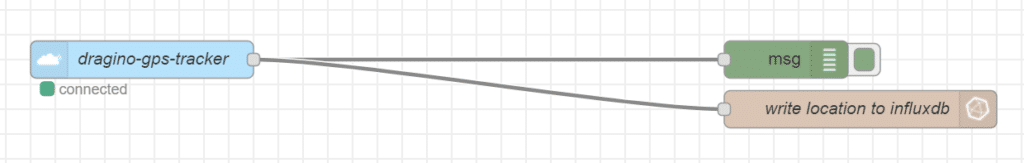
If all is right you can click Deploy in the upper right corner. The gray dot on the dragino-gps-tracker box has to be green to show it’s connected to TTN. You can see the new payloads coming in Node-RED in the debug window on the right. Select “Debug messages” from the hamburger menu.
Connecting Node-RED to InfluxDB
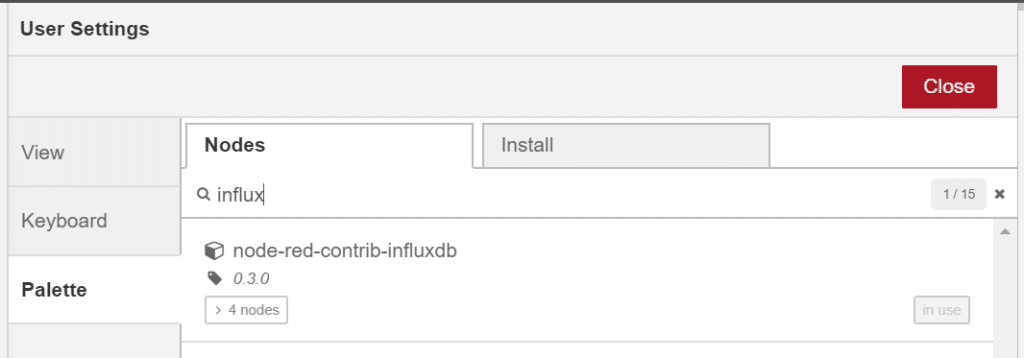
Install InfluxDB on your system and create a new database. There are many manuals online you can follow. Now let’s connect Node-RED to InfluxDB. Click on the hamburger menu / Palette. Search for the node-red-contrib-influxdb palette and install it. Click Close and restart Node-RED.
You will now see some influxdb boxes under the storage menu on the left. Drag the brown influxdb out node to the flow on the right.
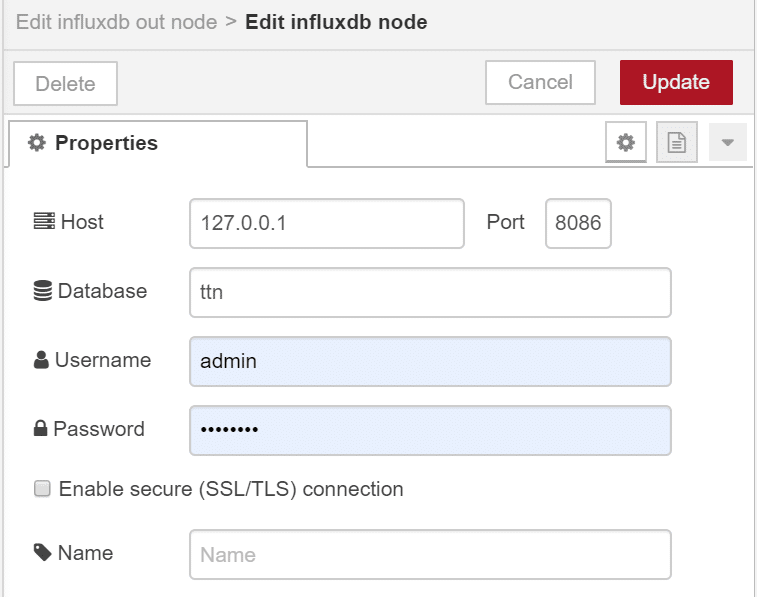
Double click it and click on the pencil next to Server to create a new database connection. Fill in the ip address of the Host, the port and the previously created database. Enter the user credentials and Click Update.
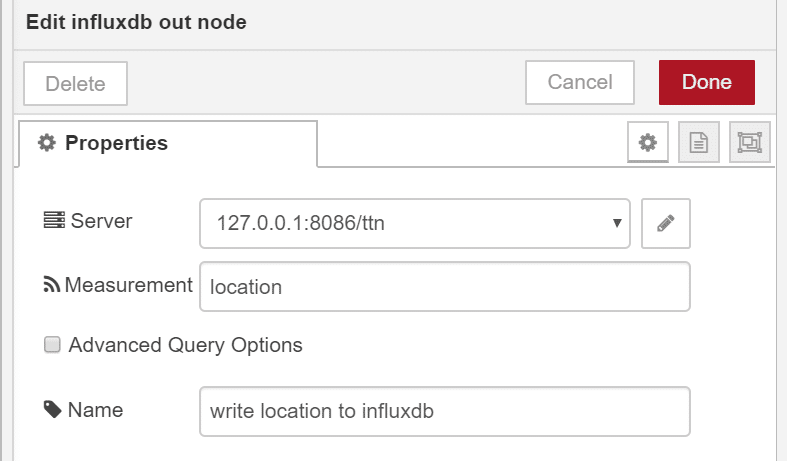
You are now back in the influxdb out node properties, select the just created server. Enter “location” in the Measurement field to fill the location table with the output of the payload from the GPS Tracker. Give it a name and click on Done.
You have now successfully created the database connection. Click on Deploy to apply the changes. The debug window gives you some messages for troubleshooting connection issues.
Connect Grafana to InfluxDB
First you have to install the InfluxDB data source and connect to the just created InfluxDB database. Click on Configuration / Data Sources and search for the InfluxDB data source. Give it a name, fill in the ip address and port number. Under Auth, select “With Credentials” and fill in the Database name, username and password to connect to InfluxDB.
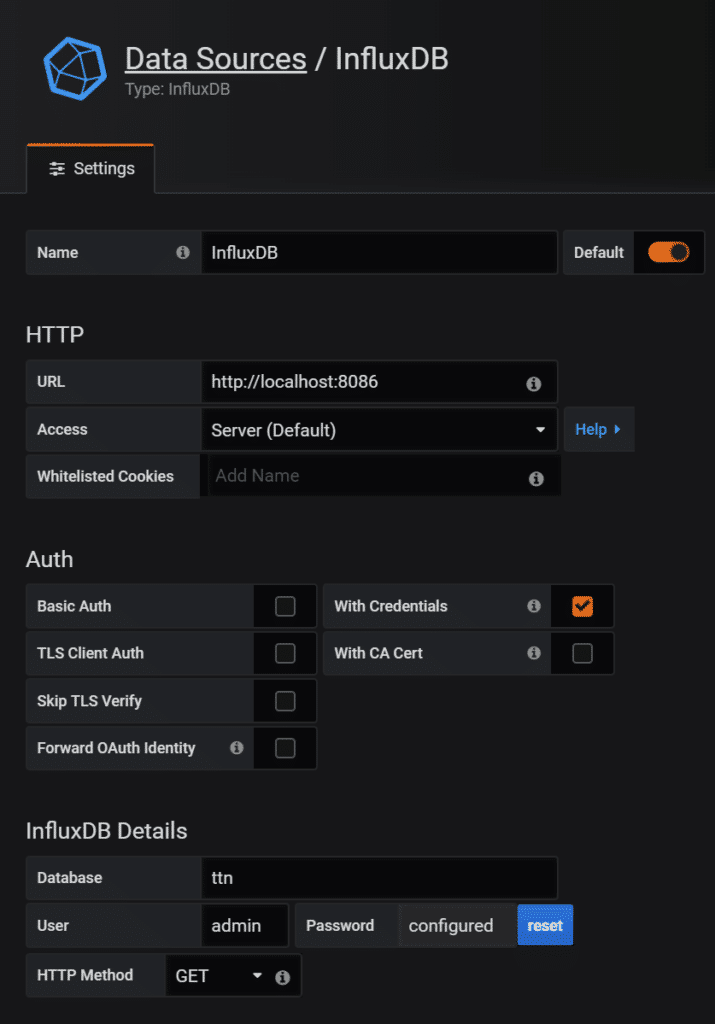
Click on Save & Test to apply the changes.
Installing the Grafana TrackMap plugin
You are now ready to install the Grafana TrackMap plugin. This plugin uses the location information from the database to display it on a map. You can even make a graph of the battery voltage and configure an alarm when you have to recharge the battery.
You can install the TrackMap plugin the cli. Just install it by entering:
sudo grafana-cli plugins install pr0ps-trackmap-panel
You are now able to add a new visualisation when you add a new dashboard. Just fill in the next fields and the locations from the tracker will be displayed on the map.
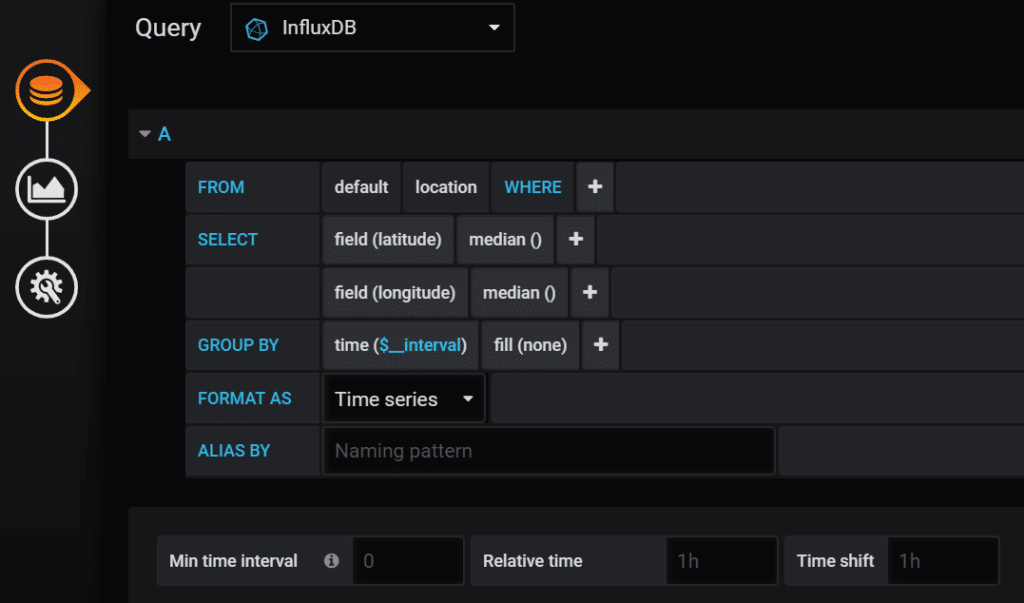
You can paste this into grafana to make it more easy:
SELECT median("latitude"), median("longitude") FROM "location" WHERE $timeFilter GROUP BY time($__interval) fill(none)
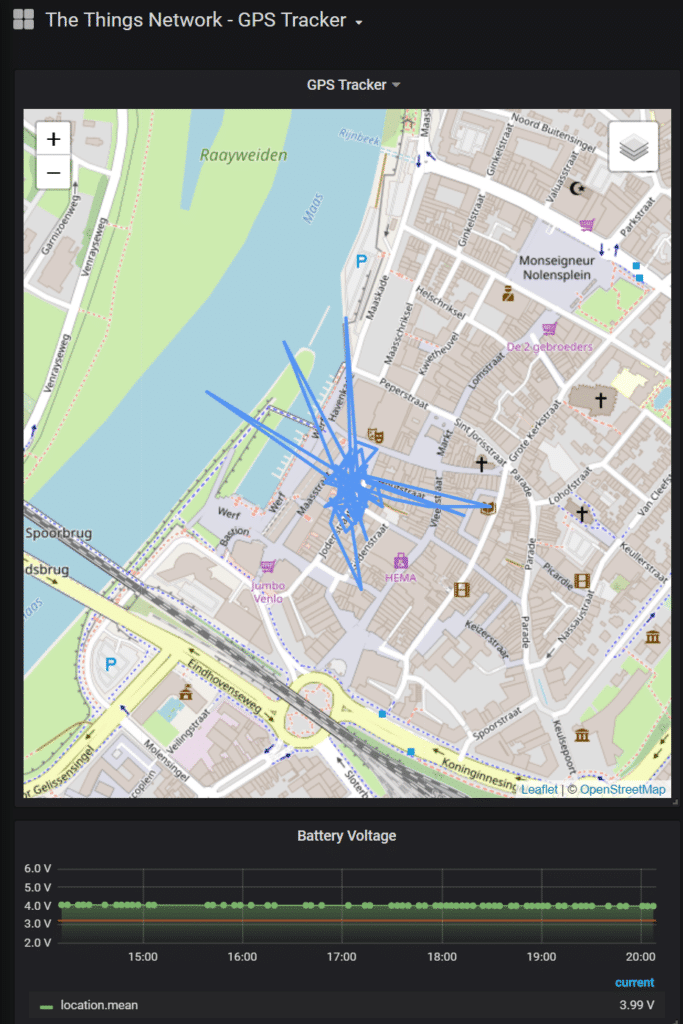
Adding the battery graph
Did you see the battery graph in the previous screenshot? You can enable this by creating a new graph. Just enter the following fields:
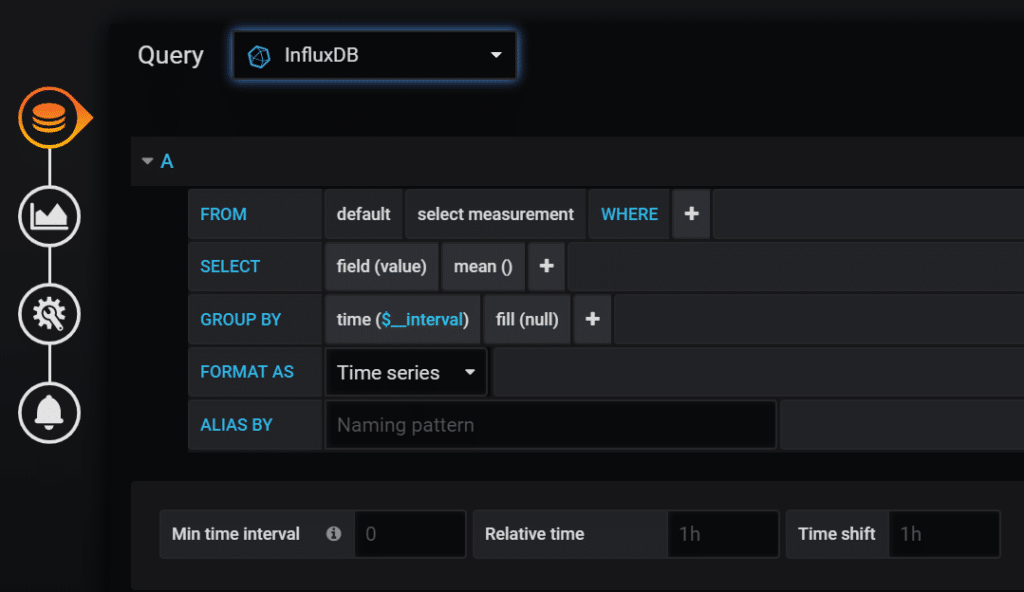
You can paste the following code to make it easy for yourselve:
SELECT mean("value") FROM "measurement" WHERE $timeFilter GROUP BY time($__interval) fill(null)
Change the following settings:
- Visualisation / Draw Modes / Points: enabled
- Visualisation / Stacking & Null Value: Connected
- Axes / Left Y / Y-Min 0
- Axes / Left Y / Y-Max 5.5
- Axes / Left Y / Units / Energy / Volt
- Legend / Options / To the right: enable
- Legend / Options / Values / Current: enable
- Thresholds & Time Regions / T1 gt : 2,8 – Color Critical – Line: enabled
That’s it, you’re done!